Brain Evolution Rides the Golden Spiral
— Dileep Saxena
I. Evolutionary Spiral
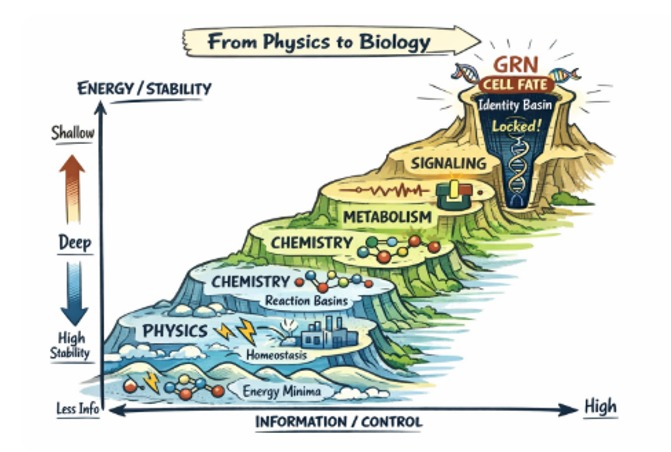
Physics to Biology — Evolutionary Spiral
"Evolutionary spirals originates not with the beginning of organic life.
'Life works because physics works!!'
It had already rooted in the balance between: Information / Energy-Stability - Control
That is the landscape where layers of attractors emerge in basins of physical & biochemical stacked upwards.
The master ratio of Energy vs Information is the most fundamental predictor of further emergence of:
(A) High E/I (ratio) → Deep Attractors
GRN: Gene Regulatory Networks → Leading to Cell Fate/Development
(B) Low E/I (ratio) → Shallow Attractors
Neural Policies → Cognition, Behaviors
Whenever E/I ratio drops below a critical threshold, shallow policy control becomes viable.
"Why it works":
1. GRN state changes require: Chromatin remodelling, protein turnover & metabolic restructuring.
2. Neural state changes require: Spike timing, inhibition shifts, & neuro-modulators release.
II. Life Processes Are Logically Emergent
Landscape Layers (stacked in one surface)
| Layer |
Basins |
Info |
Depth |
| 1. Physics |
Energy minima, dissipation channels |
~0 (no memory) |
Shallow, fast |
| 2. Chemistry |
Reaction equilibria, oscillators |
Stoichiometric constraints |
Slightly deeper |
| 3. Metabolism |
Homeostatic flux states |
Energy bookkeeping |
Medium (viability-gated) |
| 4. Signaling |
Switch states, pulses |
Thresholds, timing |
Conditional, context-sensitive |
| 5. GRN (cell fate) |
Gene-expression attractors |
High (identity encoded) |
Very deep, canalized |
Therefore "Life-Attractors" logic creates backgrounds for "Life Control Processes".
(a) Creating from Energy/Information ratios → riding stepladders upto "GRN Basins". These GRN basins "Genes", as called [even called as "Selfish Genes" by some], lock this basin information as "Identity." Nucleotides, combine to emerge into chromosomal locked possibilities → Rules only: For example: Homeobox sets..., Replications & Environmental pressures help form into spiral explosions of variances, branches into branches of identities evolving to cover whole spectrum of life forms on this planet.
(b) Over these identity locked to explode in various life patterns & niches, there arises an opportunity for "Neural States". (Actually "GRN Identity" & "Neural States", both are emergent attractors, but they operate at radically different depths and timescales.)
Shared Core Idea Both are nonlinear dynamical systems with multiple attractor states
| Property |
GRN Attractor |
Neural Attractor |
| Represents |
Stable gene-expression configuration |
Stable activity pattern |
| Defines |
Cell fate |
Memory, percept, belief, decision |
| Timescale |
Hours → Days → Lifetime |
Milliseconds → Seconds → Minutes |
| Stability |
Very high |
Tunable, reversible |
| Key Question |
"What kind of cell am I allowed to be?" |
"What state am I currently in?" |
Neural Attractors
(c) Neural "State" attractors are the nodal end of identities, and from here the logics are driven by policy of evolutionary spanderals — variety of activity patterns are now niches of neural attractors. They all have prediction error ownership, and task dependant, context sensitive logics gating their evolutionary spirals.
III. Primary Driver for Intelligence
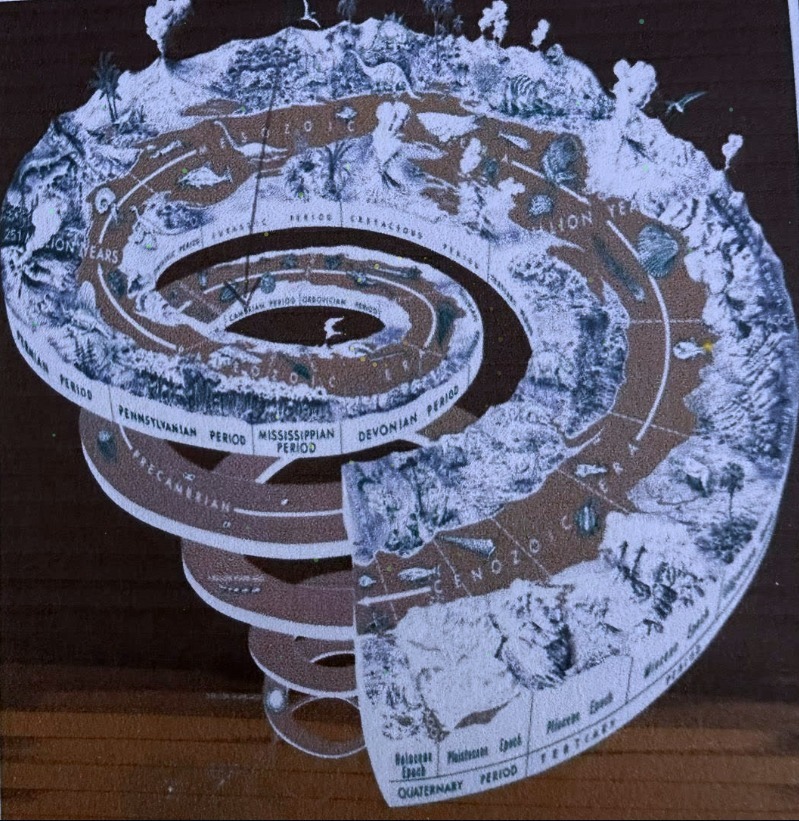
4.5 billion years of evolution — compressed into one spiral
Everything related to intelligence has roots in primary cause of motor activity (movements). This is always with aims to explore, interact & find energy source for homeostatic needs (feedback loops).
Intelligence is capacity to find some solutions for immediate surrounding survival needs along lifetime. This requires memory manifolds as flexible grid patterns, to stabilise these activity patterns into tunable but stable states.
(3) Real brain structures evolves from ANS/BNS parts of primitive organisms, & organisation of these neural nets form cephalic region of "Hypothalamus" controlling (primary homeostats & valence).
Now evolutionary course of brain is totally driven by needs of organism for their relevant 'niches'.
As we humans peek into past course of our developed highly adaptable & abstract logics, we actually "hit a jackpot".... as, they all passed through the evolutionary course, rewritten, edited, erased so much diversly;
...yet serendipity & luck brings us to our present & now AI is waiting to take over...!!
What Follows — Brain Evolution (8 Scenes)
SCENE I — THE TRIUNE BRAIN
Paul MacLean proposed three nested brain systems: reptilian, paleomammalian, and neomammalian — each layer built on the last. Not three separate brains, but three functional strata. Older circuits persist beneath newer additions — suppressed, modulated, but never removed. The triune model is heuristic, not literal anatomy. Modern neuroimaging shows deep integration — layers cooperate, not compete.
SCENE II — BRAINSTEM: THE ANCIENT CORE
The brainstem governs what cannot wait for thought: heart rate, respiration, arousal, blood pressure — the floor of consciousness. The reticular activating system modulates global brain arousal. The brainstem is 500 million years old. Sharks share its blueprint with humans.
SCENE III — LIMBIC SYSTEM
Emerged ~200 million years ago with early mammals. Hippocampus indexes episodic memories. Amygdala assigns emotional salience. Anterior cingulate cortex — the hinge between limbic drive and cortical control.
SCENE IV — NEOCORTEX
Six-layered, ~16 billion neurons, 76% of brain volume. Cortical folding allows 2,500 cm² of surface area.
SCENE V — PREFRONTAL CORTEX
Last to mature (age 25). Working memory, executive control, impulse suppression. Damasio's somatic marker hypothesis: emotion guides rational choice.
SCENE VI — MOTOR CORTEX
Intelligence arose through the body, not despite it. Cerebellum: 69 billion neurons. Motor prediction loops are the template for thought itself.
SCENE VII — TC LOOP
Feedback from cortex to thalamus outnumbers feedforward 10:1. The thalamus is modulated by what cortex expects to receive.
SCENE VIII — REFLEX TO REFLECTION
From brainstem reflex to prefrontal deliberation: 500 million years of neural architecture, all running simultaneously.
▶ View Brain Evolution — Animated Presentation
⚙ Animation Under Construction
Dileep Saxena